Data driven mindset: Using data to grow your business
Having the power of data at your fingertips is a game-changer for business strategy.
But the key isn’t just having data, it’s knowing how to analyse it, use it and how best to implement it into your strategy, as well as your everyday decisions.
With better data comes fewer mistakes, reduced costs, improved decisions, superior products, increased customer satisfaction, more efficiency, competitive advantage and a much quicker turnaround for making it all happen.
Using quality data to guide your business is no longer a nice to have but critical to business success.
Before we share how to use data to inform your business strategy, let’s look into the data-driven mindset and how it can play a role within your business.
What is a data-driven mindset?
A data-driven mindset is a type of decision-making based on data and facts rather than assumptions or intuition. Businesses use data-driven perspectives to make better, more efficient decisions with reduced error.
A data-driven mindset allows you to question areas or processes in your business and then answer them with data.
Below is an illustration of an intuition-driven decision mindset, which involves a lot of guesswork and trial and error:

Replacing the intuition-driven mindset with a data-driven mindset yields valuable insights that drive better decisions and results:

The data-driven mindset is sometimes criticised for being too driven by data and not leaving room for any human intuition. Instead, they rely on a data-informed mindset.
So, what’s the difference between a data-driven mindset and a data-informed mindset?
Data-driven vs. data-informed mindset
The data-informed mindset views data more as a tool, rather than a complete driver. It can encourage you to take a step back from time to time to see the bigger picture and how data plays a part.
While a data-driven mindset is based more on analysing data that you’ve collected to spot areas for improvement or optimisation, a data-informed mindset is based more on coming up with new ideas, then using data to validate it.
To derive the best possible business outcomes from your data, it’s a good idea to use a combination of the two. While you don’t want to ignore your gut instinct entirely, you should be testing it using data.
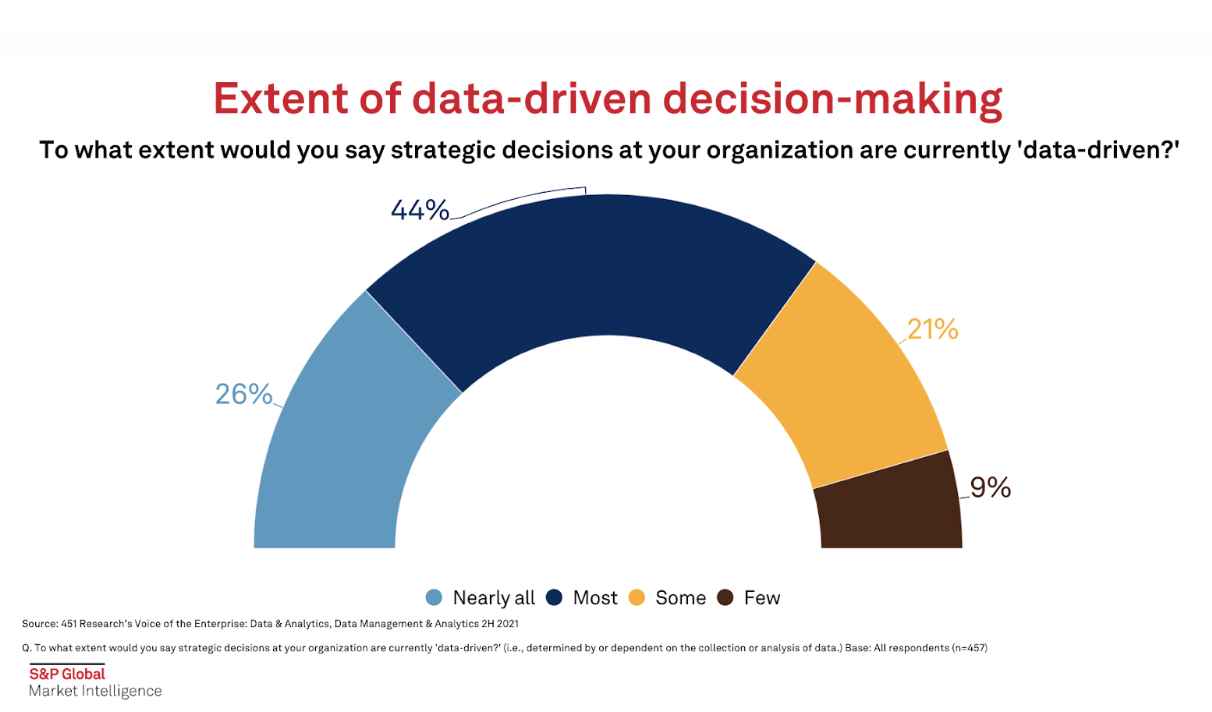
Though many businesses have realised the power of data in decision-making, many still have a way to go in leveraging available data to improve their decisions.
In S&P Global’s Voice of the Enterprise survey, they found that only around 25% of employees believe that all of their organisation’s strategic decisions are driven by data.
Although businesses have the potential to collect and analyse so much valuable data about their business, they’re not always sure exactly how to go about it.
So, let’s look into how you can implement data into your business strategies.
How to use data to inform business strategies
Follow the steps below to start driving more effective decisions in your team or business.
1. Look at your company or team objectives
In order to gather the right insights from all the available data in your business, you need to think about your goals.
What is it that you’re trying to achieve in your business? What are the milestones that you’re trying to reach?
Whether you’re a business that’s aiming to grow, or an agency looking to provide your client with the right insights, starting off with the goals is key.
For example, if you’re looking to increase the conversion rate on your website, it can be useful to look at data around the user funnel or customer journey.
- Where are users dropping off?
- What are they spending the most time looking at?
- What steps are they taking before they convert?
With the right tool, you can answer these questions.
2. Get a data analytics tool
Next, you’ll need to start collecting your data.
The tool you’ll use will depend on your goal. Most businesses are looking to convert more customers, so let’s stick with this example.
In this case, you’ll need a website analytics tool that can show you:
- How many users are visiting your pages?
- Where they’re coming from?
- Where they’re going?
- How they’re behaving?
- What they’re looking at?
- What’s working?
- What’s not working?
- How many users are converting?
Luckily for you, we’ve got an analytics tool that does all of the above.
Flowpoint shows you the user journey on your website, breaking it down into granular insights.
The tool lets you map out specific user flows to analyse data on how they’re interacting with your website. With these unique insights, you can spot new ideas, test them, or even monitor where things aren’t working so well.
If you’d like to try Flowpoint’s free trial, you can do so here.
3. Benchmark your data
In order to make data-driven improvements, you’ll need to know how well your business is performing.
You can find this sort of data from third party resources, such as Statista, Smart Insights, IRP Commerce, or many more.
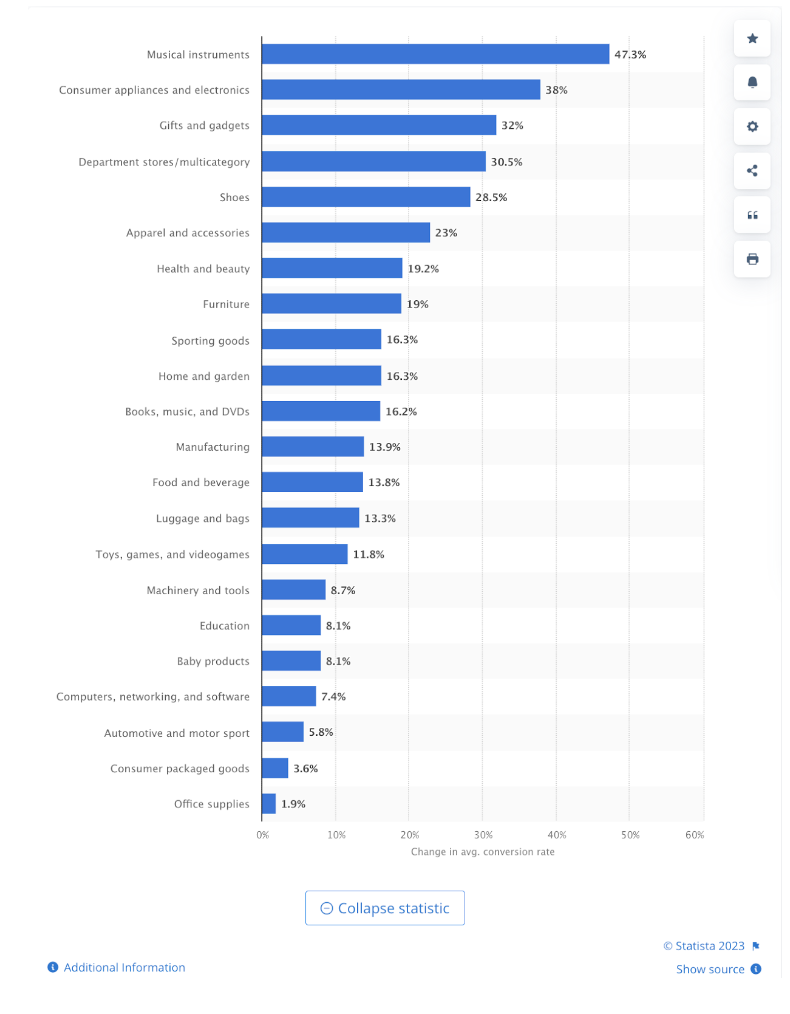
Let’s say through using your Flowpoint tool you’ve found that 30% of people are clicking on a testimonial on your landing page. From this data, we can hypothesise that by including more reviews on your pages, you’ll boost your conversion rate.
Statista has the third party data to let you know the average growth in conversion rate when you display reviews and ratings by industry. From this secondary data, you can expect to see some sort of boost in customer conversions:
With Flowpoint, your business can benchmark results against itself. The web analytics tool allows you to compare the activity of user cohorts from different time periods. We’ll explain this a little more below.
4. Analyse your data
Now it’s time to perform an analysis of the web data.
Continuing on with our conversions example, we’ll want to analyse the performance of the reviews and whether or not they’re having an impact on your conversion rate.
Let’s imagine that your gut is telling you that the reviews are having little to no impact on conversions. Rather than making an intuition-driven decision, let’s take a look at the data.
We know that with Flowpoint, we can compare user cohorts over time, so it would be a good idea to compare your website’s conversion rate for the month before you introduced the reviews, with the month after.
If you were to find that conversions actually increased during this time, then the best data-driven decision would be to keep them — your gut instinct was wrong!
You could even take a look back to the Statista data to compare how this new review feature performed compared to the industry average.
In this example, it might even be worth testing to see if updating the reviews regularly with more recent content has an impact.
5. Draw new conclusions from the data
Naturally as you look at the data, you’ll draw conclusions from it. But it’s always a good idea to spend a little more time with your data, to see if you can spot anything else.
To help guide you, ask yourself these questions:
- What is this data confirming that I already knew?
- Is this data telling me anything new?
- How can this data help to drive me towards my team or business goals?
Discover your data-driven decision making tool
Start collecting website data and extracting actionable insights with Flowpoint.
Our user behaviour tool helps businesses make better data-driven decisions with quality data.
To find out more about how we can help your business to scale, reach out to a member of our friendly team today by booking an intro call here.
Contact
FLOWPOINT ANALYTICS LTD
Company Number 14068900
83-86 Prince Albert Road, London, UK
© 2024. All rights reserved @Flowpoint